
Remote sensing of Planet Earth – Part 2: Processing Sentinel-2 optical imagery

By Cervest
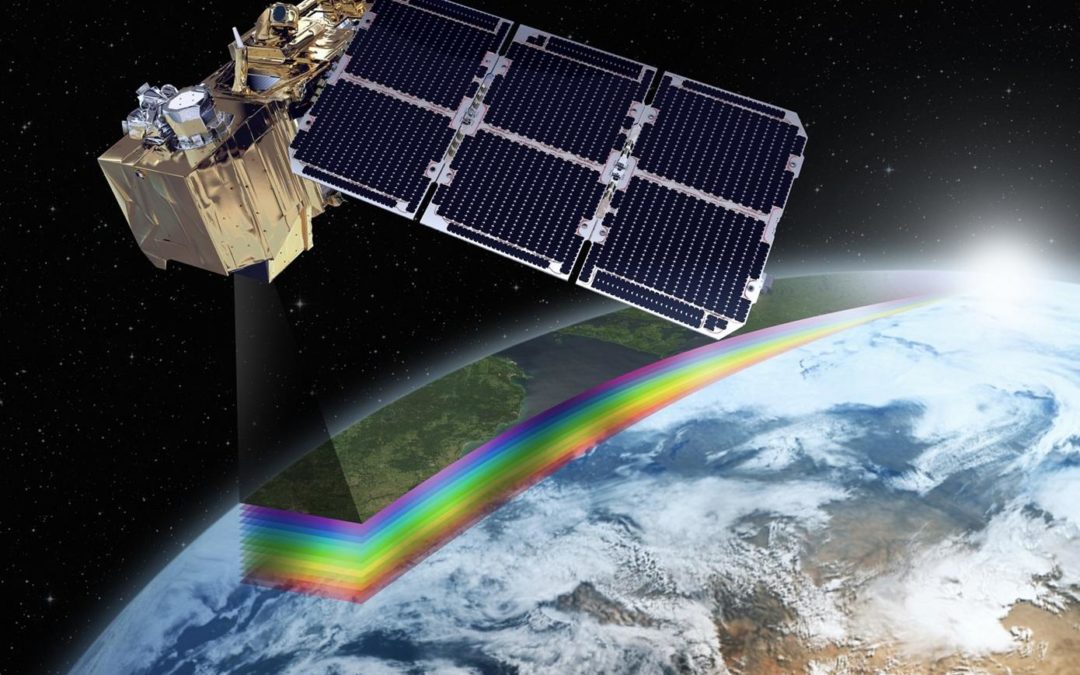
Illustrative image of an Earth observation satellite from the Sentinel-2 mission
The first part of this series introduced Sentinel-2 as an optical imagery monitoring mission by Copernicus used at Cervest. This blog post will go into depth about Sentinel-2 images and why we cannot use them in their raw form including the errors that appear in measurements.
The basics of Sentinel-2
Sentinel-2 consists of two satellites Sentinel-2A and Sentinel-2B with high spatial resolution images of 10m, 20m and 60m and a combined temporal resolution of 5-6 days. The data is provided in 13 spectral bands presented in Figure 1.
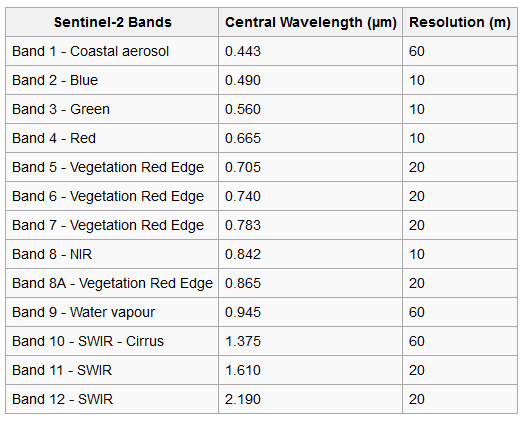
Table showing the different bands present in Sentinel-2: resolution represents the width of the range of wavelengths, the central wavelength is the center of the range. Source: Satellite Imaging Corporation
Sentinel-2 provides data in different levels depending on the processing applied to the products. Level-1 products are basic products giving a Top of Atmosphere (TOA) picture composed of three levels (A, B and C) each with increasing levels of processing. Level-2 includes atmospheric corrections that create Bottom of Atmosphere (BOA) images.
What are the issues with raw Sentinel-2 images?
At Cervest we are interested in what is happening on the ground. However, when light from the ground is measured by satellites it is affected by some physical processes that need to be corrected for. Geometric and radiometric errors are corrected for in Level-1 products while the effect of the atmosphere is corrected for in Level-2 products.
The first conversion decompresses Level-1A images after which Level-1B provides radiometric correction. This deals with the issue of light intended for a pixel appearing in an adjacent pixel because it scatters off molecules in the atmosphere. This correction is also used as a calibration method.
Another issue is that when a satellite takes a picture it needs to map the globe onto a 2D image with mathematical functions called projections. As Sentinel-2 orbits at a high altitude the images are affected by the Earth’s curvature. Additionally, structures like mountains are not easy to photograph. Finally, while a picture is being taken both the satellite and the Earth are moving, thus distorting the images. Geometric corrections are implemented to fix all these errors. The resulting images are provided in Level-1C products which come with a cloud mask labelling individual pixels as cloudy or not.
Another big source of errors is atmospheric effects which are corrected for in Level-2 products. The atmosphere consists of water vapour, ozone and aerosol, all of which can scatter light. Atmospheric correction is based on the ability to model the signal this scatter creates in the sensors. Various organisations model this in different ways, which also results in different cloud masks.
How did we test different atmospheric correction and cloud mask methods?
Since there are different ways to correct for the influence of the atmosphere, we compared four different methods: Sentinel-2 L2A processor (Sen2cor), Framework for Operational Radiometric Correction for Environmental monitoring (FORCE), MACCS-ATCOR Joint Algorithm (MAJA) and Sensor Invariant Atmospheric Correction (SIAC). To evaluate them we compared the time series of the Normalized Difference Vegetation Index (NDVI) for individual plots after each of the correction approaches. NDVI is a transformation of the red and near infrared (NIR) bands. Chlorophyll in a plant absorbs large amounts in the red band while reflecting in the NIR band so the difference between the bands acts as an indicator of the amount of chlorophyll present. As the plant grows chlorophyll, the NDVI is expected to increase. For seasonal crops this will continue until the crop reaches maturity where it starts yellowing, leading to a decrease in the NDVI value and finally harvest where the NDVI returns to that of just the bare soil. The NDVI series for the different methods we tested for two fields can be seen below.
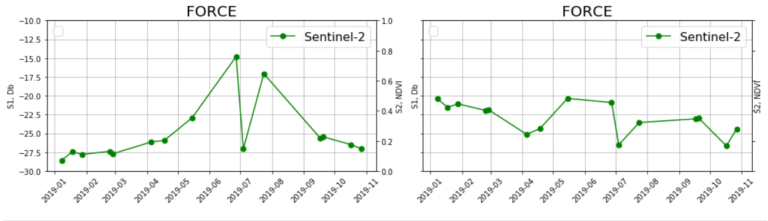
Sentinel-2 NDVI time series after four different atmospheric correction methods Sen2Cor, MAJA, SIAC and FORCE for two different fields for comparison
The graphs show the NDVI time series from Sentinel-2 over 2018 for two fields using four different atmospheric correction methods. The first field probably has a seasonal crop growing as indicated by the increasing NDVI until June. The second field probably has nothing growing on it resulting in an almost constant NDVI over the whole year.
FORCE results in very low NDVI values from January to July – the time when crops should be growing. It also has outliers, caused by mislabelling of pixels. Sen2Cor produces a time series with relatively high NDVI all year round resulting in the peak being less prominent than in other methods, while also having outliers. MAJA seems to model the trend well due to a stringent cloud mask. However, this removed many points and would make statistical modeling results very difficult. SIAC is the one we have chosen at Cervest. The graph shows that there are few outliers while emulating the expected structure of an NDVI curve well.
Why did we choose SIAC?
Atmospheric correction in SIAC relies on MODIS data as a prior. It uses 6S Radiative Transfer Model which models ozone, water vapour and aerosol to simulate the path of light as it travels from the Earth to the detector on the satellite. It also provides uncertainties associated with each band, so NDVI can be provided with uncertainty. SIAC uses machine learning to identify clouds and its shadows, which are difficult to identify. The dip in luminosity can be due to the soil’s colour or the sun’s luminosity based on the time of day that the picture was taken. These additional functionalities are very beneficial to obtain cleaner data, which is why we chose SIAC as our atmospheric correction method."
The atmospheric correction and cloud mask we chose will allow us to do many new things. With better atmospheric correction, biophysical parameters such as Leaf Area Index (LAI) or fraction of Photosynthetically Active Radiation (fPAR) can be calculated more accurately. We can then incorporate this into applications like our yield models.
About us: We are Ramani, Maxim, and Owen, part of the Cervest Science team, a group of statisticians, machine learning & natural scientists, and software engineers. We aim to solve urgent problems within Earth Science through application of machine learning tools and techniques.
If you’re interested in what we do, then please head over to our careers page!
Share this article
Our latest news and insights

Accenture and Cervest collaborate to bring innovative solutions to clients seeking resilience amid increased climate risk
Read more

What is climate intelligence and why do businesses and governments need it?
Read more